The Acute Physiology and Chronic Health Evaluation II (APACHE II) score remains one of the most widely used severity-of-illness scoring systems in intensive care units worldwide. Introduced in 1985, it evaluates 12 physiological variables, age, and chronic health status within the first 24 hours of ICU admission to produce a score ranging from 0 to 71.
In Indian ICU practice, APACHE II serves a dual purpose: it informs clinical decision-making about prognosis and resource allocation, and it provides objective severity documentation that TPA insurance reviewers and medicolegal authorities rely on to assess whether the intensity of ICU care was justified.
This guide covers every component of the APACHE II score, how to calculate it accurately, how it differs from SOFA, and how to document it for maximum clinical and administrative value.

What Is the APACHE II Score?
APACHE II was developed by Knaus et al. in 1985 as an improvement over the original APACHE system. It simplified the scoring from 34 physiological variables down to 12, making it practical for bedside use while maintaining strong predictive validity.
The score comprises three components:
- Acute Physiology Score (APS) — 12 physiological variables, each scored 0–4 (max 60 points)
- Age Points — 0–6 points based on age
- Chronic Health Points — 0–5 points based on pre-existing organ insufficiency
Total APACHE II = APS + Age Points + Chronic Health Points
The maximum theoretical score is 71, though scores above 40 are exceptionally rare. Higher scores correspond to higher predicted in-hospital mortality.
APACHE II is calculated using the worst values from the first 24 hours of ICU admission — not admission values and not current values. This is a critical distinction. If a patient’s blood pressure was stable at admission but dropped to a MAP of 55 at hour 18, the MAP of 55 is used for scoring.
APACHE II: The 12 Physiological Variables
Each variable is scored from 0 (normal) to +4 (severely abnormal) based on deviation from normal — in either direction. Both high and low abnormal values receive points.
1. Temperature (Rectal, °C)
| Value | Score |
|---|---|
| 36.0–38.4 | 0 |
| 38.5–38.9 or 34.0–35.9 | +1 |
| 39.0–40.9 or 32.0–33.9 | +3 |
| ≥ 41.0 or 30.0–31.9 | +3 |
| ≤ 29.9 | +4 |
Document the highest or lowest core temperature within the first 24 hours. Axillary temperatures are unreliable in ICU patients — use rectal, oesophageal, or bladder temperature where available.
2. Mean Arterial Pressure (mmHg)
| Value | Score |
|---|---|
| 70–109 | 0 |
| 110–129 or 50–69 | +2 |
| 130–159 | +2 |
| ≥ 160 or ≤ 49 | +4 |
Use the MAP that produces the highest score within the first 24 hours. For patients on vasopressors, the MAP before vasopressor initiation (if lower) or the lowest MAP despite vasopressor support may both be relevant. Document the timing and context.
3. Heart Rate (ventricular rate, bpm)
| Value | Score |
|---|---|
| 70–109 | 0 |
| 110–139 or 55–69 | +2 |
| 140–179 or 40–54 | +3 |
| ≥ 180 or ≤ 39 | +4 |
4. Respiratory Rate (non-ventilated or ventilated)
| Value | Score |
|---|---|
| 12–24 | 0 |
| 25–34 or 10–11 | +1 |
| 35–49 or 6–9 | +3 |
| ≥ 50 or ≤ 5 | +4 |
5. Oxygenation
If FiO₂ ≥ 0.5: use A-a gradient (A-aDO₂)
| A-a Gradient | Score |
|---|---|
| < 200 | 0 |
| 200–349 | +2 |
| 350–499 | +3 |
| ≥ 500 | +4 |
If FiO₂ < 0.5: use PaO₂
| PaO₂ (mmHg) | Score |
|---|---|
| > 70 | 0 |
| 61–70 | +1 |
| 55–60 | +3 |
| < 55 | +4 |
The oxygenation component switches between A-a gradient and PaO₂ depending on FiO₂. This is a common source of calculation errors. Always check whether the patient’s FiO₂ is above or below 0.5 before selecting the scoring method. Document the FiO₂ alongside the ABG values.
6. Arterial pH
| Value | Score |
|---|---|
| 7.33–7.49 | 0 |
| 7.50–7.59 or 7.25–7.32 | +1 |
| 7.60–7.69 or 7.15–7.24 | +3 |
| ≥ 7.70 or < 7.15 | +4 |
If arterial blood gas is unavailable, serum bicarbonate (HCO₃⁻) can be used as a substitute. However, ABG is strongly preferred and expected in ICU patients. Document which value was used for scoring.
7. Serum Sodium (mEq/L)
| Value | Score |
|---|---|
| 130–149 | 0 |
| 150–154 or 120–129 | +2 |
| 155–159 or 111–119 | +3 |
| ≥ 160 or ≤ 110 | +4 |
8. Serum Potassium (mEq/L)
| Value | Score |
|---|---|
| 3.5–5.4 | 0 |
| 5.5–5.9 or 3.0–3.4 | +1 |
| 6.0–6.9 or 2.5–2.9 | +2 |
| ≥ 7.0 or < 2.5 | +4 |
9. Serum Creatinine (mg/dL)
| Value | Score |
|---|---|
| 0.6–1.4 | 0 |
| 1.5–1.9 or < 0.6 | +2 |
| 2.0–3.4 | +3 |
| ≥ 3.5 | +4 |
Double the creatinine score for acute renal failure. If the patient has acute kidney injury (not chronic kidney disease), the creatinine score is multiplied by 2. This distinction is clinically significant — document whether the renal failure is acute, chronic, or acute-on-chronic.
10. Haematocrit (%)
| Value | Score |
|---|---|
| 30.0–45.9 | 0 |
| 46.0–49.9 or 20.0–29.9 | +2 |
| 50.0–59.9 | +2 |
| ≥ 60.0 or < 20.0 | +4 |
11. White Blood Cell Count (×10³/µL)
| Value | Score |
|---|---|
| 3.0–14.9 | 0 |
| 15.0–19.9 or 1.0–2.9 | +2 |
| 20.0–39.9 | +2 |
| ≥ 40.0 or < 1.0 | +4 |
12. Glasgow Coma Scale (GCS)
The GCS component is calculated as: 15 minus actual GCS
| GCS | Score |
|---|---|
| 15 | 0 |
| 13–14 | +1 to +2 |
| 10–12 | +3 to +5 |
| 7–9 | +6 to +8 |
| 3–6 | +9 to +12 |
For sedated patients, use the estimated pre-sedation GCS or the GCS recorded before sedation was initiated. If no pre-sedation GCS is available, document this limitation — a GCS of 3 in a patient on propofol infusion is not the same as GCS 3 in an unsedated patient.
Automate severity scoring for every ICU patient
Rivara Health calculates SOFA scores automatically from your daily notes — so you never miss a documentation requirement.
Age Points
| Age (years) | Points |
|---|---|
| ≤ 44 | 0 |
| 45–54 | 2 |
| 55–64 | 3 |
| 65–74 | 5 |
| ≥ 75 | 6 |
Chronic Health Points
Patients with severe chronic organ insufficiency or immunocompromised status receive additional points:
- Non-operative or emergency postoperative patients: +5 points
- Elective postoperative patients: +2 points
Chronic health conditions that qualify include:
- Liver: Biopsy-proven cirrhosis, portal hypertension, hepatic encephalopathy, or upper GI bleeding from portal hypertension
- Cardiovascular: NYHA Class IV heart failure
- Respiratory: Chronic restrictive, obstructive, or vascular disease causing severe exercise limitation or documented chronic hypoxia, hypercapnia, or pulmonary hypertension
- Renal: Chronic dialysis
- Immunocompromised: Therapy that suppresses resistance to infection (immunosuppression, chemotherapy, radiation, high-dose steroids) or a disease sufficiently advanced to suppress immunity (e.g., AIDS, leukaemia)
Document chronic health conditions explicitly on admission. A patient with biopsy-proven cirrhosis who is admitted as an emergency receives +5 chronic health points — but only if the cirrhosis is documented in the admission note. Undocumented chronic health conditions cannot be retrospectively added to the score.
APACHE II and Predicted Mortality
The APACHE II score is converted to predicted mortality using a logistic regression equation that incorporates the score and the diagnostic category. The following table provides approximate mortality predictions:
| APACHE II Score | Approximate Mortality |
|---|---|
| 0–4 | ~4% |
| 5–9 | ~8% |
| 10–14 | ~15% |
| 15–19 | ~25% |
| 20–24 | ~40% |
| 25–29 | ~55% |
| 30–34 | ~75% |
| ≥ 35 | ~85%+ |
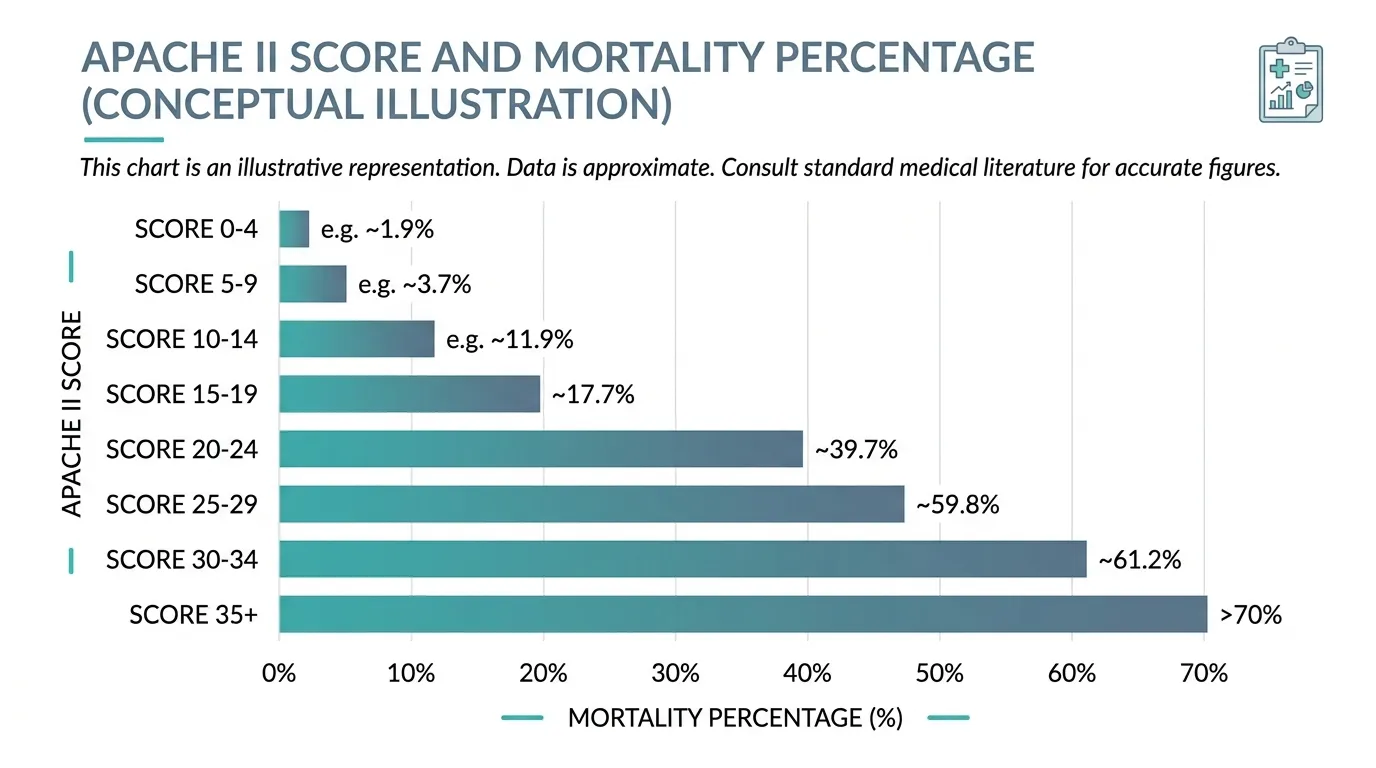
These mortality predictions are based on the original 1985 validation cohort. Modern ICU care has improved survival across all score ranges, so actual mortality in a contemporary Indian ICU is generally lower than these predictions. However, the relative severity stratification remains valid and is widely accepted by TPA reviewers and courts.
APACHE II vs SOFA: When to Use Which
Both APACHE II and SOFA are standard ICU severity scores, but they serve different purposes:
| Feature | APACHE II | SOFA |
|---|---|---|
| When calculated | Once — first 24 hours of admission | Daily — throughout the ICU stay |
| Purpose | Admission severity and predicted mortality | Ongoing organ dysfunction tracking |
| Variables | 12 physiological + age + chronic health | 6 organ systems |
| Score range | 0–71 | 0–24 |
| Includes age? | Yes | No |
| Includes chronic health? | Yes | No |
| Tracks trends? | No (single time point) | Yes (daily scoring) |
| TPA relevance | Establishes admission severity | Justifies ongoing ICU care day-by-day |
The two scores are complementary, not competing. APACHE II establishes how sick the patient was at admission; SOFA tracks how the patient responds to treatment over time. For complete ICU documentation, both should be recorded.
For a detailed guide to SOFA score calculation across all 6 organ systems, see our complete SOFA score guide for ICU clinicians.
APACHE II and TPA Insurance Claims in India
TPA reviewers use APACHE II scores as part of their severity assessment on two fronts:
1. Justifying ICU admission. A patient with an APACHE II score of 22 at admission clearly required ICU-level care. The score provides an objective, standardised metric that is harder to dispute than a subjective clinical assessment.
2. Justifying prolonged ICU stay. While SOFA scores track daily severity, the admission APACHE II score sets the baseline expectation. A high APACHE II score predicts a complicated, prolonged ICU course — making a 15-day ICU stay more defensible than if the admission APACHE II was low.
Common TPA issues related to APACHE II:
- APACHE II score claimed without supporting physiological data in the notes
- Score calculated from values outside the first 24 hours (incorrect methodology)
- Chronic health points claimed without documented chronic conditions
- APACHE II and SOFA scores inconsistent with each other (e.g., high APACHE II but low SOFA throughout the stay, or vice versa)
An APACHE II score that cannot be verified from the documented lab values and vitals will be disregarded by the TPA reviewer. Always ensure the individual component values are traceable in the clinical record.
Your documentation should protect you — not create more work
Rivara Health generates audit-proof ICU discharge summaries with severity scores, daily clinical notes, and complete medication records — in under 2 minutes.
5 Practical Tips for APACHE II Documentation
-
Calculate within the first 24 hours — not later. The score uses the worst values from hours 0–24 of ICU admission. Calculating retrospectively from Day 3 data is methodologically incorrect and a TPA reviewer will spot this.
-
Document each component value. Do not just record “APACHE II = 18.” Record the individual variable values (temperature, MAP, heart rate, etc.) so the score is auditable. A score without supporting data is worthless.
-
Note the FiO₂ for oxygenation scoring. The switch between A-a gradient (FiO₂ ≥ 0.5) and PaO₂ (FiO₂ < 0.5) is the most common calculation error. Always document the FiO₂ alongside the ABG.
-
Clarify acute vs chronic renal failure. The creatinine score is doubled for acute renal failure. If you are claiming the doubled score, document the evidence that the renal failure is acute (baseline creatinine, timeline of rise, ultrasound findings).
-
Record pre-sedation GCS. If the patient was sedated on arrival or within the first 24 hours, document the GCS before sedation was started. A post-sedation GCS inflates the APACHE II score and misrepresents the patient’s neurological status.
Conclusion
The APACHE II score remains a cornerstone of ICU severity assessment more than four decades after its introduction. Its combination of physiological derangement, age, and chronic health status provides a comprehensive admission severity metric that is accepted by clinicians, insurance reviewers, and courts.
For ICU doctors in India, accurate APACHE II documentation at admission — combined with daily SOFA score tracking — provides a defensible, objective record of illness severity that supports both clinical decision-making and insurance claim approval.
Tools like Rivara Health’s ICU Summary Generator help ensure that the physiological data needed for accurate severity scoring is captured systematically from admission onward, reducing the risk of documentation gaps that lead to TPA claim rejections.
Related reading: SOFA Score in ICU: Complete Guide for Clinicians | ICU Discharge Summary for TPA Insurance Claims
Medical Disclaimer
This article is for informational and educational purposes only. It does not constitute medical advice, diagnosis, or treatment. Always consult a qualified healthcare professional for clinical decision-making. Rivara Health provides documentation tools — clinical judgement remains with the treating physician.
Reduce ICU Documentation Time by 90%
Generate medicolegal-grade ICU discharge summaries in under 2 minutes. Built for Indian hospitals, designed for TPA compliance.