The Simplified Acute Physiology Score (SAPS) is one of the three major severity scoring systems used in intensive care medicine, alongside APACHE and SOFA. Developed to predict hospital mortality from data collected within the first 24 hours of ICU admission, SAPS offers a streamlined alternative to APACHE — requiring fewer variables while maintaining strong predictive accuracy.
SAPS II, introduced in 1993, remains the most widely validated version globally. SAPS 3, published in 2005, added pre-ICU admission data and regional calibration to improve predictions across different healthcare systems. Both versions are used in clinical practice, benchmarking, and increasingly in insurance documentation to establish illness severity at ICU admission.
This guide covers both SAPS II and SAPS 3 — their variables, scoring tables, mortality prediction, and how they compare to APACHE II and SOFA in clinical and documentation contexts.

What Is the SAPS Score?
The Simplified Acute Physiology Score was created by Jean-Roger Le Gall and colleagues as a simpler alternative to the original APACHE system. The motivation was practical: APACHE required numerous variables that were not always available in every ICU, particularly in resource-limited settings. SAPS aimed to achieve comparable predictive accuracy with fewer data points.
The SAPS family includes three versions:
- SAPS I (1984) — the original version with 13 variables; now largely obsolete
- SAPS II (1993) — the most widely used version with 17 variables; validated across 137 ICUs in 12 countries
- SAPS 3 (2005) — the most recent version with 20 variables; includes pre-admission data and regional calibration
In current practice, SAPS II is the standard reference when clinicians refer to “the SAPS score.” SAPS 3 is used in units that require more granular prognostication or participate in international benchmarking studies.
Like APACHE II, SAPS II is calculated from the worst values in the first 24 hours of ICU admission. It is a single-timepoint admission severity score — not a daily tracking tool like SOFA. This distinction matters for documentation: SAPS II tells you how sick the patient was at admission, not how they are progressing.
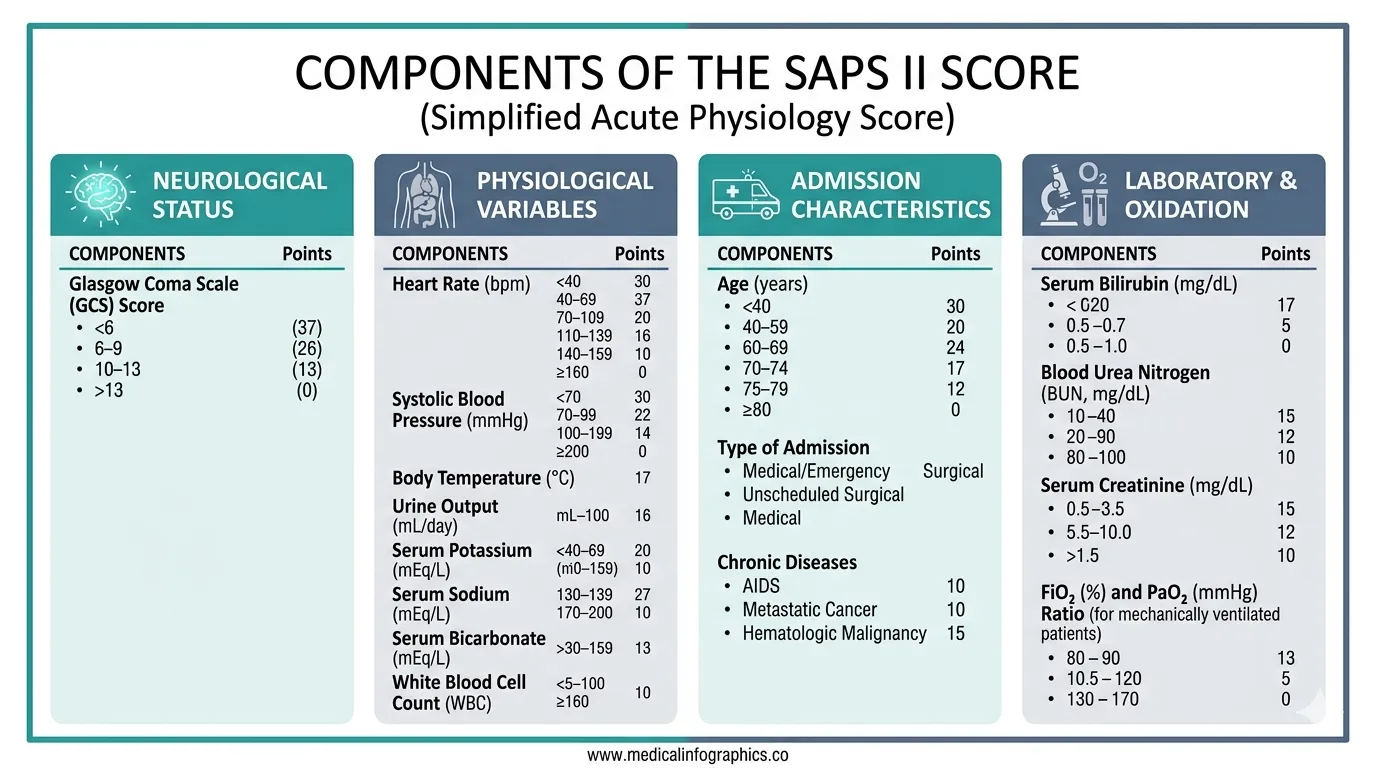
SAPS II: Variables and Scoring
SAPS II uses 17 variables grouped into three categories: 12 physiological variables, age, and 3 variables reflecting the type and chronicity of the admission. Each variable is assigned a weighted point value based on logistic regression coefficients — unlike APACHE II, where each variable scores 0–4, SAPS II assigns different point ranges to different variables based on their statistical contribution to mortality prediction.
Physiological Variables
The 12 physiological variables are recorded as the worst values from the first 24 hours of ICU admission.
1. Age
| Age (years) | Points |
|---|---|
| < 40 | 0 |
| 40–59 | 7 |
| 60–69 | 12 |
| 70–74 | 15 |
| 75–79 | 16 |
| ≥ 80 | 18 |
Age carries the highest single-variable point allocation in SAPS II. A patient aged 80+ receives 18 points from age alone — roughly equivalent to the mortality impact of a severe physiological derangement. This reflects the strong independent effect of age on ICU mortality observed in the original validation cohort.
2. Heart Rate (bpm)
| Value | Points |
|---|---|
| 70–119 | 0 |
| 120–159 | 4 |
| ≥ 160 | 7 |
| 40–69 | 2 |
| < 40 | 11 |
3. Systolic Blood Pressure (mmHg)
| Value | Points |
|---|---|
| 100–199 | 0 |
| ≥ 200 | 2 |
| 70–99 | 5 |
| < 70 | 13 |
Severe hypotension (systolic BP < 70 mmHg) receives 13 points — the highest physiological variable score in SAPS II. This reflects the well-established relationship between refractory hypotension and ICU mortality. Document the lowest systolic BP within the first 24 hours, including the clinical context (pre-resuscitation, post-fluid bolus, on vasopressors).
4. Body Temperature (°C)
| Value | Points |
|---|---|
| < 39.0 | 0 |
| ≥ 39.0 | 3 |
5. PaO₂/FiO₂ Ratio (if ventilated or on CPAP)
| Value | Points |
|---|---|
| ≥ 200 | 6 |
| 100–199 | 9 |
| < 100 | 11 |
The PaO₂/FiO₂ ratio is only scored if the patient is on mechanical ventilation or CPAP. If the patient is breathing spontaneously without ventilatory support, this variable is scored as 0 (not applicable). This is a common source of error — do not assign oxygenation points to non-ventilated patients.
6. Urine Output (L/day)
| Value | Points |
|---|---|
| ≥ 1.0 | 0 |
| 0.500–0.999 | 4 |
| < 0.500 | 11 |
Document 24-hour urine output meticulously during the first day of ICU admission. A urine output below 500 mL/day scores 11 points — equivalent to the score for severe hypoxaemia. Missing urine output data means this variable cannot be scored, potentially understating severity.
7. Serum Urea or BUN (mg/dL)
| BUN (mg/dL) | Points |
|---|---|
| < 28 | 0 |
| 28–83 | 6 |
| ≥ 84 | 10 |
8. White Blood Cell Count (×10³/µL)
| Value | Points |
|---|---|
| 1.0–19.9 | 0 |
| ≥ 20.0 | 3 |
| < 1.0 | 12 |
9. Serum Potassium (mEq/L)
| Value | Points |
|---|---|
| 3.0–4.9 | 0 |
| ≥ 5.0 | 3 |
| < 3.0 | 3 |
10. Serum Sodium (mEq/L)
| Value | Points |
|---|---|
| 125–144 | 0 |
| ≥ 145 | 1 |
| < 125 | 5 |
11. Serum Bicarbonate (mEq/L)
| Value | Points |
|---|---|
| ≥ 20 | 0 |
| 15–19 | 3 |
| < 15 | 6 |
12. Bilirubin (mg/dL)
| Value | Points |
|---|---|
| < 4.0 | 0 |
| 4.0–5.9 | 4 |
| ≥ 6.0 | 9 |
13. Glasgow Coma Scale
| GCS | Points |
|---|---|
| 14–15 | 0 |
| 11–13 | 5 |
| 9–10 | 7 |
| 6–8 | 13 |
| < 6 | 26 |
GCS below 6 carries the single highest variable score in SAPS II at 26 points. For sedated patients, use the pre-sedation GCS or the estimated GCS off sedation. A pharmacologically suppressed GCS of 3 should not be used for SAPS II calculation — document the sedation status and estimated neurological function.
Admission Type
| Type of Admission | Points |
|---|---|
| Scheduled surgical | 0 |
| Medical | 6 |
| Unscheduled surgical | 8 |
Chronic Disease Variables
Three chronic diseases receive additional points if present prior to admission:
| Chronic Condition | Points |
|---|---|
| Metastatic cancer | 9 |
| Haematological malignancy | 10 |
| AIDS | 17 |
Document pre-existing chronic conditions on the admission note. AIDS, haematological malignancy, and metastatic cancer each carry significant point allocations in SAPS II. If these conditions are not documented at admission, the SAPS II score will understate severity — and the missing data cannot be reliably added retrospectively.
SAPS II: Total Score and Mortality Prediction
The total SAPS II score is the sum of all variable points. The theoretical maximum is 163, though scores above 80 are rare in clinical practice. The score is converted to predicted hospital mortality using a logistic regression equation:
Predicted Mortality = e^(logit) / (1 + e^(logit))
where logit = −7.7631 + 0.0737 × SAPS II score + 0.9971 × ln(SAPS II score + 1)
In practice, the following approximations are widely referenced:
| SAPS II Score | Approximate Mortality |
|---|---|
| < 30 | ~10% |
| 30–39 | ~15–20% |
| 40–49 | ~25–35% |
| 50–59 | ~45–55% |
| 60–69 | ~65–75% |
| 70–79 | ~80–85% |
| ≥ 80 | ~90%+ |
These mortality predictions are derived from the 1993 validation cohort across European and North American ICUs. As with APACHE II, modern ICU care generally achieves lower actual mortality than these predictions. However, the relative stratification remains clinically valid — a SAPS II of 60 still represents a categorically more severe illness than a SAPS II of 30, regardless of the absolute mortality figure.
Stop calculating severity scores manually
Rivara Health automatically computes severity scores from your daily note entries — ensuring complete, auditable documentation for every ICU patient.
SAPS 3: The Next Generation
SAPS 3 was developed in 2005 by Moreno et al. to address key limitations of SAPS II. The most significant innovation was the inclusion of pre-ICU data — recognising that what happens before ICU admission substantially affects outcome.
SAPS 3 comprises three “boxes” of variables:
Box I: Patient Characteristics Before ICU Admission
- Age
- Pre-existing comorbidities (chronic health status)
- Length of hospital stay before ICU admission
- Location before ICU (e.g., operating room, emergency department, ward, other hospital)
- Use of major therapeutic options before ICU (vasoactive drugs, mechanical ventilation)
Box II: Circumstances of ICU Admission
- Planned or unplanned admission
- Surgical status (no surgery, scheduled surgery, emergency surgery)
- Reason for ICU admission (anatomical site of surgery or medical diagnosis category)
- Infection status at ICU admission (nosocomial, respiratory, other)
Box III: Physiological Variables at ICU Admission
- GCS (lowest)
- Highest heart rate
- Lowest systolic blood pressure
- Highest bilirubin
- Highest body temperature
- Highest creatinine
- Highest WBC count
- Lowest platelet count
- Lowest pH
- Mechanical ventilation and oxygenation status
A critical difference between SAPS 3 and SAPS II: SAPS 3 uses values from one hour before or after ICU admission — not the worst values from the first 24 hours. This captures severity at the point of ICU entry rather than the worst point in the first day, which can be influenced by the quality of early ICU care.
Regional Calibration in SAPS 3
One of the most important features of SAPS 3 is regional calibration. The original SAPS 3 study included over 16,000 patients from 303 ICUs across 35 countries, and the investigators recognised that baseline mortality varies significantly between regions due to differences in healthcare infrastructure, case mix, and clinical practices.
SAPS 3 provides region-specific logistic regression equations for:
- Australasia
- Central and South America
- Central and Western Europe
- Eastern Europe
- North Europe
- Southern Europe and Mediterranean
- South and West Asia (includes India)
For ICUs in India and South Asia, the SAPS 3 regional calibration for “South and West Asia” provides more accurate mortality predictions than applying the global SAPS 3 equation or using SAPS II or APACHE II predictions calibrated on Western cohorts. If your unit participates in quality benchmarking, SAPS 3 with regional calibration is the preferred tool.
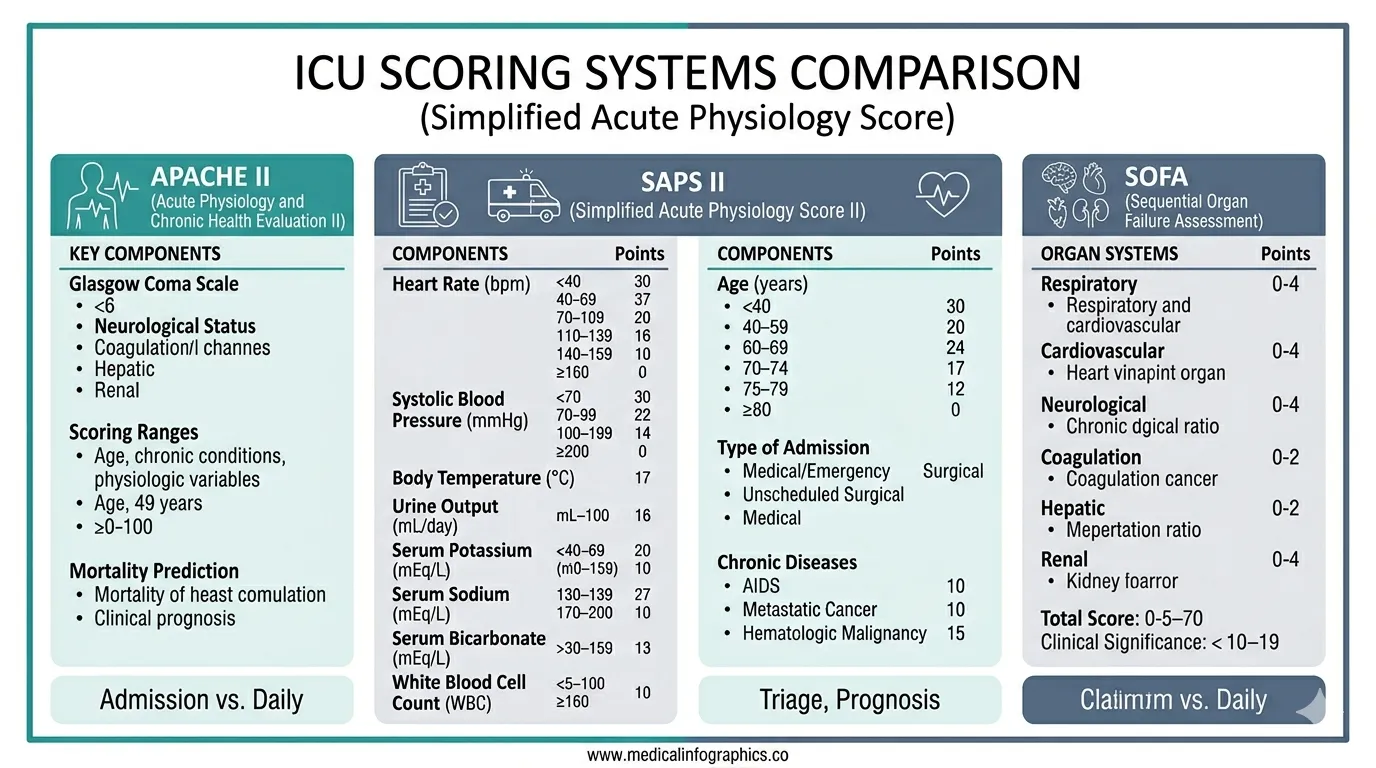
SAPS vs APACHE II vs SOFA: When to Use Which
All three scoring systems are valid, but they answer different clinical questions and serve different documentation purposes.
| Feature | SAPS II | SAPS 3 | APACHE II | SOFA |
|---|---|---|---|---|
| Year introduced | 1993 | 2005 | 1985 | 1994 |
| When calculated | First 24 hours | ±1 hour of admission | First 24 hours | Daily |
| Number of variables | 17 | 20 | 14 (12 + age + chronic) | 6 |
| Score range | 0–163 | 0–217 | 0–71 | 0–24 |
| Includes age? | Yes | Yes | Yes | No |
| Includes chronic health? | Yes (3 conditions) | Yes (expanded) | Yes | No |
| Pre-ICU data? | No | Yes | No | No |
| Regional calibration? | No | Yes | No | No |
| Tracks daily trends? | No | No | No | Yes |
| Primary purpose | Admission severity | Admission severity | Admission severity | Organ dysfunction tracking |
The choice between SAPS II and APACHE II for admission severity scoring often comes down to institutional preference and regional convention. In Europe, South America, and parts of Asia, SAPS II is more commonly used. In North America and India, APACHE II has traditionally been dominant. Both are accepted by TPA reviewers, provided the supporting data is documented.
The fundamental complementarity remains the same regardless of which admission score you choose: an admission severity score (SAPS II, SAPS 3, or APACHE II) establishes baseline illness severity, while daily SOFA scores track the trajectory of organ dysfunction throughout the ICU stay. Both are needed for comprehensive ICU documentation.
For a detailed breakdown of each SOFA component, see our complete SOFA score guide for ICU clinicians. For APACHE II specifics, see the APACHE II score calculation guide.
SAPS Score and Insurance Documentation
TPA insurance reviewers evaluate severity scores as part of their assessment of whether ICU admission and the duration of ICU stay were clinically appropriate. While APACHE II is more commonly requested in Indian TPA workflows, SAPS II is equally valid as an admission severity metric and is accepted by most reviewers when properly documented.
What reviewers expect to see:
- The total SAPS II score with the individual variable values — a score without supporting data is unverifiable
- Timing documentation — confirmation that values were recorded within the first 24 hours of ICU admission
- Consistency with other severity indicators — a high SAPS II should correlate with high SOFA scores and clinical interventions (vasopressors, mechanical ventilation, RRT)
- Chronic disease documentation — if AIDS, metastatic cancer, or haematological malignancy points were included, the underlying diagnosis must be documented in the admission record
Common documentation pitfalls:
- Reporting a SAPS II score without the underlying physiological data
- Using values from beyond the first 24 hours (methodologically incorrect for SAPS II)
- Failing to document the GCS assessment context (sedated vs unsedated)
- Omitting urine output from the first 24 hours — the single most frequently missing SAPS II variable
A SAPS II score that cannot be independently verified from the documented lab values, vitals, and clinical observations will carry no weight in a TPA dispute or medicolegal proceeding. The score itself is meaningless without the data that produced it. Always ensure each variable value is traceable in the clinical record.
Limitations of SAPS Scoring
No severity score is perfect, and clinicians should understand the limitations of SAPS when interpreting or documenting results.
SAPS II limitations:
- Calibrated on 1991–1992 data. ICU mortality has declined substantially since then, so SAPS II tends to overestimate mortality in modern ICUs. A SAPS II-predicted mortality of 50% may correspond to actual mortality of 30–35% in a well-resourced contemporary unit.
- No regional calibration. Unlike SAPS 3, SAPS II applies the same equation globally. Performance varies between settings — predictions calibrated on European ICUs may not transfer directly to Indian or Southeast Asian ICUs.
- Limited chronic health variables. Only three chronic conditions (AIDS, metastatic cancer, haematological malignancy) receive points. Other significant comorbidities — such as advanced COPD, NYHA Class IV heart failure, or chronic liver disease without malignancy — are not captured.
- Does not track trends. Like APACHE II, SAPS II is a snapshot. It cannot reflect improvement or deterioration after the first 24 hours.
SAPS 3 addresses several of these through regional calibration, broader comorbidity capture, and a more contemporary validation cohort. However, SAPS 3 is more complex to calculate, and adoption outside of research and benchmarking settings remains limited.
When documenting severity for TPA or medicolegal purposes, explicitly state which scoring system was used (SAPS II vs SAPS 3 vs APACHE II) and the time window of data collection. Mixing variables from different scoring systems or time windows invalidates the score.
Your documentation should protect you — not cost you hours
Rivara Health generates audit-proof ICU discharge summaries with severity scores, daily progress notes, and complete clinical records — in under 2 minutes.
6 Practical Tips for SAPS Documentation
-
Collect all variables within the first 24 hours. SAPS II requires the worst values from hours 0–24 of ICU admission. Set a process to capture vitals, labs, urine output, and GCS within this window. Missing even one variable weakens the score.
-
Record the PaO₂/FiO₂ ratio only for ventilated patients. The oxygenation component in SAPS II applies exclusively to patients on mechanical ventilation or CPAP. Scoring this variable for spontaneously breathing patients inflates the score incorrectly.
-
Document GCS with sedation context. A GCS of 3 in a patient on propofol is pharmacological, not neurological. Record whether the GCS reflects the patient’s actual neurological status or is confounded by sedation. Use the pre-sedation GCS where available.
-
Track 24-hour urine output from ICU admission. This is the most commonly omitted SAPS II variable. Oliguria (< 500 mL/day) carries 11 points — a significant contribution that is lost if urine output is not documented.
-
Document chronic conditions on admission. AIDS, haematological malignancy, and metastatic cancer each carry substantial point allocations. These must be documented in the admission note — retrospective addition is unreliable and may be challenged.
-
State which SAPS version you used. SAPS II and SAPS 3 use different variables, time windows, and equations. Always specify the version in your documentation. Mixing elements from different versions produces an invalid score.
Medical Disclaimer
This article is for informational and educational purposes only. It does not constitute medical advice, diagnosis, or treatment. Always consult a qualified healthcare professional for clinical decision-making. Rivara Health provides documentation tools — clinical judgement remains with the treating physician.
Conclusion
The SAPS scoring system — particularly SAPS II — provides a validated, internationally recognised method for quantifying illness severity at ICU admission. With 17 variables covering physiology, demographics, admission context, and chronic disease, it offers a comprehensive admission severity metric that is simpler to calculate than APACHE II while maintaining comparable predictive accuracy.
For ICU clinicians, the choice between SAPS II and APACHE II is often institutional. What matters more than the choice of system is the quality of documentation behind the score. A well-documented SAPS II score — with every variable traceable to an objective measurement recorded within the first 24 hours — provides robust evidence of illness severity for clinical decision-making, TPA insurance claims, and medicolegal defence.
Combined with daily SOFA score tracking, an admission SAPS II or APACHE II score creates a complete severity documentation arc: how sick the patient was on arrival, and how their organ function evolved throughout the ICU stay. This is the standard that TPA reviewers and courts increasingly expect.
Tools like Rivara Health’s ICU Summary Generator systematically capture the physiological data needed for accurate severity scoring from admission onward, ensuring that the documentation meets audit standards without adding to the clinician’s workload.
Related reading: SOFA Score in ICU: Complete Guide for Clinicians | APACHE II Score: Complete Calculation Guide | Complete Guide to ICU Discharge Summaries
Medical Disclaimer
This article is for informational and educational purposes only. It does not constitute medical advice, diagnosis, or treatment. Always consult a qualified healthcare professional for clinical decision-making. Rivara Health provides documentation tools — clinical judgement remains with the treating physician.
Reduce ICU Documentation Time by 90%
Generate medicolegal-grade ICU discharge summaries in under 2 minutes. Built for Indian hospitals, designed for TPA compliance.